Availability
Money serving near-term Timing. It must be liquid and accessible when required, with required principal not dependent on market performance.
Elena and Marcus have $1.2 million to meet $1 million of expected needs. On paper, that appears to be enough.
But those needs do not all arrive at the same time. Some of their money must be available now. Some will be needed in two years. Some must support a retirement transition eight years from now, while the rest is intended for much later.
The more useful question is not simply whether they have enough money. It is whether their wealth is prepared to do each job when that moment arrives.
Elena and Marcus want their wealth to provide emergency access today, support a family transition in two years, help fund retirement in eight years, and sustain their independence over the longer term.
Each need gives part of their wealth a particular job and a particular moment when it must be ready. Elena and Marcus choose what their wealth is meant to serve—its Purpose. Timing identifies when the wealth will be required. Once both are clear, we can examine how their money is arranged today—their Current Structure—and determine whether it is prepared for those responsibilities.
Money serving near-term Timing. It must be liquid and accessible when required, with required principal not dependent on market performance.
Money serving intermediate Timing. It must be accessible when required, with required principal protected from market loss through contractual terms.
Money serving long-term Timing for which market exposure is acceptable. Any Resource with downside market-volatility exposure belongs in Growth.
These three jobs are called Functional Allocation. See how Functional Allocation works.
$100,000
Availability
$100,000
Availability
$300,000
Stability
$500,000
Growth
Plus $200,000 of long-term surplus attributed to year 20.
Their current mix looks diversified by asset class. The problem appears only when each dollar is compared with the job it must do and the moment it must be ready.
All non-emergency Resources share one generalized Growth assignment.
Market-exposed Resources serve Requirements occurring in two and eight years.
This is the case’s Timing and Alignment problem: the Resources exist, but $400,000 is exposed to market loss before the moments it must serve.
A Resource exposed to market loss cannot pass the Market-Loss Alignment test for a Requirement less than ten years away—even if it is described as conservative, balanced, diversified, or bond-oriented. That is why a conventional stock-and-bond portfolio may be diversified by asset class while remaining poorly aligned with the particular moments when wealth must work.
The ten-year Market-Loss Alignment rule is an Alignment test, not a universal Clock-zone boundary. Asset class, conventional risk label, Tax Domain, and Clock position do not independently determine Functional Allocation. The Current non-emergency portfolio is assigned to Growth because that assignment is an evidenced fact of this fictional case.
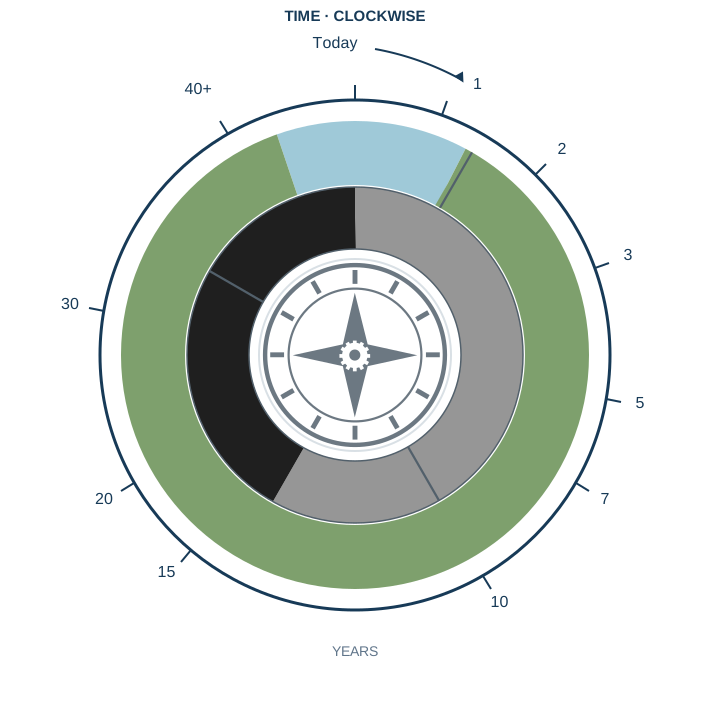
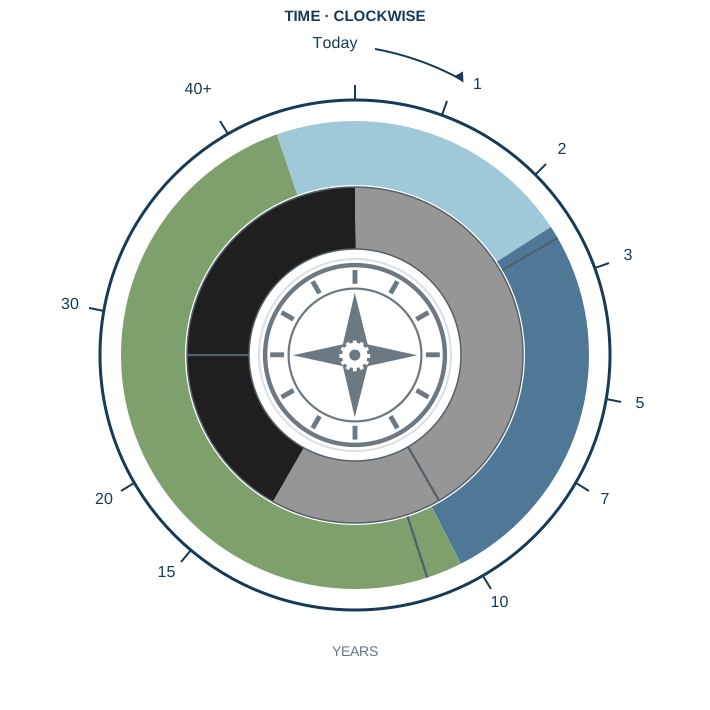
The Current Clock shows how their wealth is arranged today. The Designed Clock shows the conditional proposal after the jobs, tax locations, and one-time conversion-tax payment are modeled. The outer band shows each job; the inner grayscale band shows its Tax Domain. Segment size shows proportional represented wealth, and Timing runs clockwise.
Availability $100,000 · Stability $0 · Growth $1,100,000. Taxable $500,000 · Tax Deferred $500,000 · Tax Free $200,000. Tax Free contains $40,000 of stocks and $160,000 of bonds.
| Tranche | Amount | Timing | Asset | Allocation | Location |
|---|---|---|---|---|---|
| C-R1-Q0 | $100,000 | Today | Cash equivalent | Availability | Taxable |
| C-R2B-Q1 | $80,000 | 2 years | Bonds | Growth | Taxable |
| C-R2S-Q1 | $20,000 | 2 years | Stocks | Growth | Taxable |
| C-R2S-Q2 | $100,000 | 8 years | Stocks | Growth | Taxable |
| C-R3B-Q2 | $200,000 | 8 years | Bonds | Growth | Tax Deferred |
| C-R2S-Q3 | $100,000 | 15 years | Stocks | Growth | Taxable |
| C-R2S-S | $100,000 | 20 years | Stocks | Growth | Taxable |
| C-R3S-Q3 | $250,000 | 15 years | Stocks | Growth | Tax Deferred |
| C-R3S-S | $50,000 | 20 years | Stocks | Growth | Tax Deferred |
| C-R4S-Q3 | $40,000 | 15 years | Stocks | Growth | Tax Free |
| C-R4B-Q3 | $110,000 | 15 years | Bonds | Growth | Tax Free |
| C-R4B-S | $50,000 | 20 years | Bonds | Growth | Tax Free |
| Total | $1,200,000 | Every dollar represented exactly once. | |||
Modeled proposed—not implemented
Availability $200,000 · Stability $340,000 · Growth $635,000. Taxable $475,000 · Tax Deferred $400,000 · Tax Free $300,000. The $25,000 modeled conversion-tax payment reduces represented Resources to $1,175,000. Except for preserved emergency cash, implementing Resources are not yet defined.
| Tranche | Amount | Timing | Current source | Allocation | Location | Implementation status |
|---|---|---|---|---|---|---|
| M-R1-Q0 | $100,000 | Today | Cash equivalent | Availability | Taxable | Preserved Current Resource |
| M-R2B-Q1 | $80,000 | 2 years | Bond interest | Availability | Taxable | Not yet defined |
| M-R4B-Q1 | $20,000 | 2 years | Bond interest | Availability | Taxable | Not yet defined |
| M-R3B-Q2 | $200,000 | 8 years | Bond interest | Stability | Tax Deferred | Not yet defined |
| M-R4B-Q2 | $100,000 | 8 years | Bond interest | Stability | Taxable | Not yet defined |
| M-R4B-S | $40,000 | 20 years | Bond interest | Stability | Taxable | Not yet defined |
| M-R2S-Q3-TAX | $100,000 | 15 years | Stock interest | Growth | Taxable | Not yet defined |
| M-R2S-Q3-TF | $160,000 | 15 years | Stock interest | Growth | Tax Free | Not yet defined |
| M-R2S-S | $35,000 | 20 years | Stock interest | Growth | Taxable | Not yet defined |
| M-R3S-Q3-TD | $200,000 | 15 years | Stock interest | Growth | Tax Deferred | Not yet defined |
| M-R3S-Q3-TF | $40,000 | 15 years | Stock interest | Growth | Tax Free | Not yet defined |
| M-R3S-S | $60,000 | 20 years | Stock interest | Growth | Tax Free | Not yet defined |
| M-R4S-S | $40,000 | 20 years | Stock interest | Growth | Tax Free | Not yet defined |
| Total | $1,175,000 | Every remaining dollar represented exactly once. | ||||
A Current Clock describes the Current Structure; it does not declare it correct. A Designed Clock represents a proposed Structure; it does not establish Implementation or future Function. The Clocks represent Structure. They do not perform Discovery, Functional Measurement, Opportunity identification, recommendation, Design, Implementation, or product selection.
The Modeled Proposed Design assigns the necessary work before selecting products. It also models a one-time $100,000 Roth conversion and a $25,000 tax payment from taxable long-term Growth surplus.
MODELED DESIGN — NOT IMPLEMENTED
This case includes a modeled one-time Roth conversion, but it does not select the investments or arrangements that would carry out the broader design. Apart from the existing emergency reserve, those implementation choices remain open. Reassigning an investment does not remove its market risk.
Functional Allocation identifies what each Resource is assigned to do; asset class does not determine Functional Allocation. Current source composition remains $660,000 of stocks and $440,000 of bonds, but that composition does not define the implementing Resources for the Modeled Proposed Structure.
Product-neutral implementation requirement: Resources or arrangements with legally and economically sufficient access at the assigned Timing, with required principal not dependent on market performance and any relied-upon value established contractually under stated terms and Conditions.
This coordination is specific to the fictional case. It does not establish a universal taxable-first or Tax-Deferred-first withdrawal sequence. Allocation and Location remain separate; neither identifies a product, selects a recommendation, or authorizes Implementation.
The tradeoff: Elena and Marcus give up $25,000 of excess Resources to complete the modeled Roth conversion. That reduces Ability because fewer Resources remain. Within the complete Modeled Proposed Design, improved Alignment and Efficiency more than offset that reduction. The Roth conversion contributes specifically by changing Functional Location and the remaining prospective tax effect; it does not create the Alignment improvement.
The $25,000 conversion tax is a fixed fictional case assumption. Actual Roth-conversion taxation depends on individual circumstances. This case is not tax advice or a recommendation to the reader.
Functional Capacity measures the present potential of their financial Structure before the money must act. It combines whether the money is aligned with each need, whether there is enough, and how efficiently it is allocated and located. See the definitions and calculation.
Functional Capacity = Alignment × Ability × Efficiency
| Measure | Current | Modeled Proposed | Change |
|---|---|---|---|
| Gross Resources | $1,200,000 | $1,175,000 | −$25,000 |
| Alignment | 66.6667% | 100.0000% | +33.3333 pts |
| Ability | 120.0000% | 117.5000% | −2.5000 pts |
| Allocation Efficiency | 97.9833% | 102.7021% | +4.7188 pts |
| Prospective Equivalent Tax Rate (PETR) | 10.0000% | 6.4468% | −3.5532 pts |
| Location Efficiency | 90.0000% | 93.5532% | +3.5532 pts |
| Efficiency | 88.1850% | 96.0811% | +7.8961 pts |
| Functional Capacity | 70.5480% | 112.8953% | +42.3473 pts |
Every modeled result is conditional on implementing Resources or arrangements that satisfy the recorded access, liquidity, principal-preservation, contractual-value, Timing, tax, and cost specifications. The $25,000 conversion-tax payment reduces gross Resources and Ability once; it is not deducted again through another factor. The remaining $75,750 prospective equivalent tax effect enters PETR and Location Efficiency once. The modeled +5.0000% Growth-stock Functional Alpha is a fictional modeled input—not a forecast, guarantee, or claim about any security or manager. Functional Capacity may exceed 100%; it is not a prediction, guarantee, or score of Elena or Marcus.
Total modeled improvement: 42.3473 percentage points. The bridge separates the effects of Alignment, Allocation Efficiency, the Resource outflow and Ability reduction, and Location Efficiency. It explains the calculation; it does not prescribe an implementation order.
This case shows what a governed Current-versus-Modeled comparison can make visible. The Diagnostic explains why Purpose, Timing, Structure, evidence, and human review must come before Functional Measurement.